2013–14 Estimates—Performance Report of the Office of the Auditor General of Canada—Image Descriptions
2013–14 Estimates—Performance Report of the Office of the Auditor General of Canada
Image Descriptions
Exhibit 2—Authorized spending trend
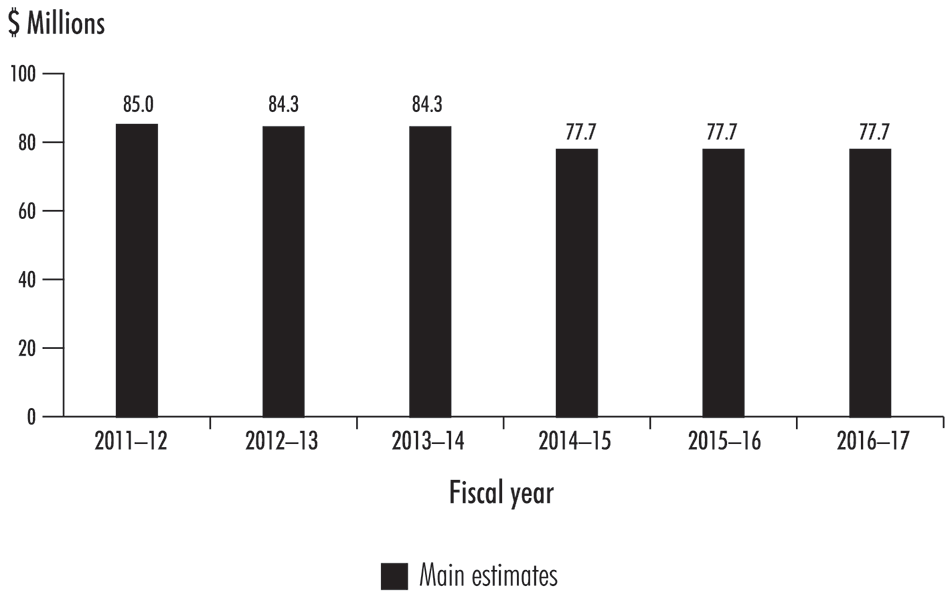
| Fiscal year | Amount in millions of dollars |
|---|---|
| 2011–12 | 85.0 |
| 2012–13 | 84.3 |
| 2013–14 | 84.3 |
| 2014–15 | 77.7 |
| 2015–16 | 77.7 |
| 2016–17 | 77.7 |
(Return)
Exhibit 4—Financial audits add value for audit committee chairs
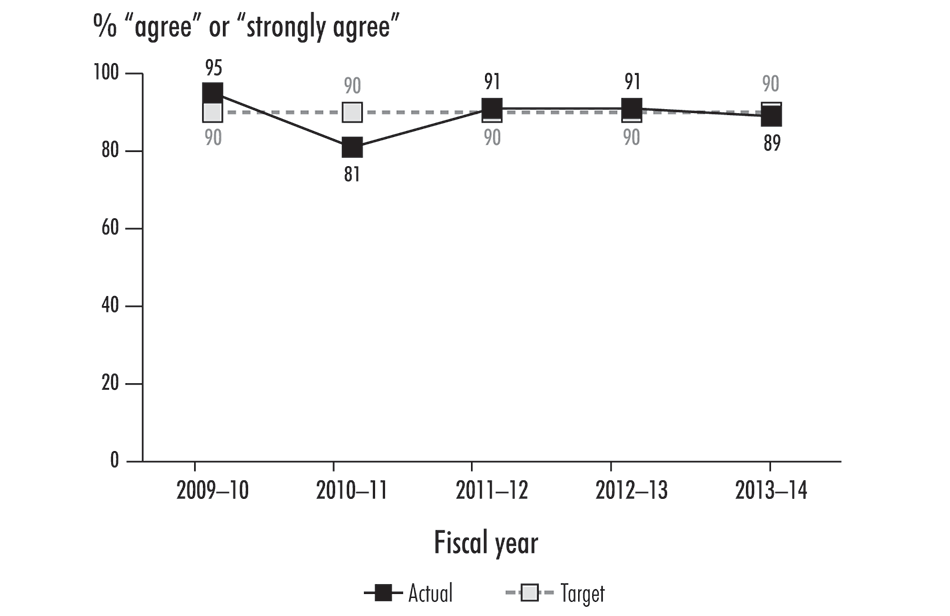
| 2009–10 | 2010–11 | 2011–12 | 2012–13 | 2013–14 | |
|---|---|---|---|---|---|
| Actual | 95 | 81 | 91 | 91 | 89 |
| Target | 90 | 90 | 90 | 90 | 90 |
(Return)
Exhibit 5—Financial audits add value for senior management
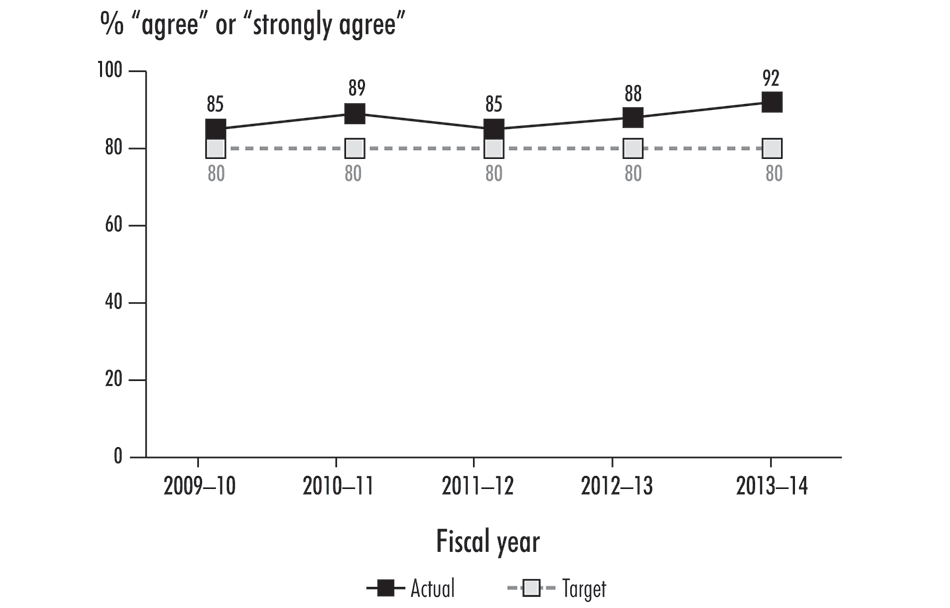
| 2009–10 | 2010–11 | 2011–12 | 2012–13 | 2013–14 | |
|---|---|---|---|---|---|
| Actual | 85 | 89 | 85 | 88 | 92 |
| Target | 80 | 80 | 80 | 80 | 80 |
(Return)
Exhibit 7—Performance audits add value for senior management
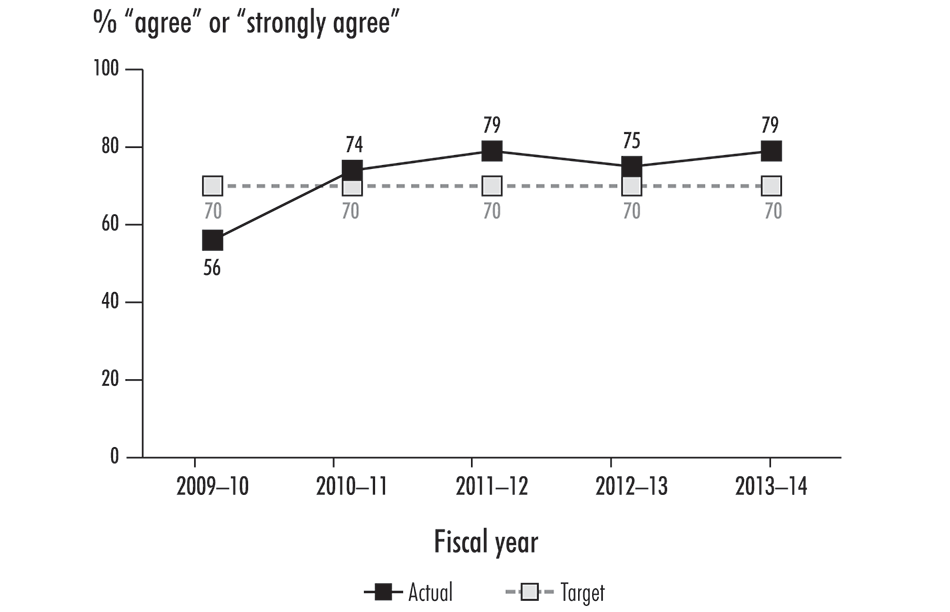
| 2009–10 | 2010–11 | 2011–12 | 2012–13 | 2013–14 | |
|---|---|---|---|---|---|
| Actual | 56 | 74 | 79 | 75 | 79 |
| Target | 70 | 70 | 70 | 70 | 70 |
(Return)
Exhibit 8—Percentage of audits completed on time
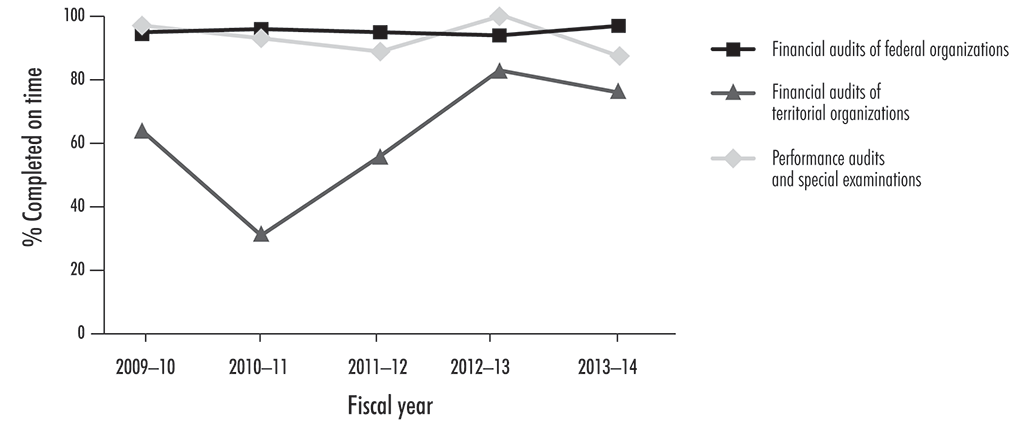
| 2009–10 | 2010–11 | 2011–12 | 2012–13 | 2013–14 | |
|---|---|---|---|---|---|
| Financial audits of federal organizations | 95.00 | 96.00 | 95.00 | 94.00 | 97.00 |
| Performance audits and special examinations | 97.11 | 93.10 | 88.90 | 100.00 | 86.90 |
| Financial audits of territorial organizations | 64.00 | 31.00 | 56.00 | 83.00 | 76.00 |
(Return)
Exhibit 9—Percentage of audits completed on budget
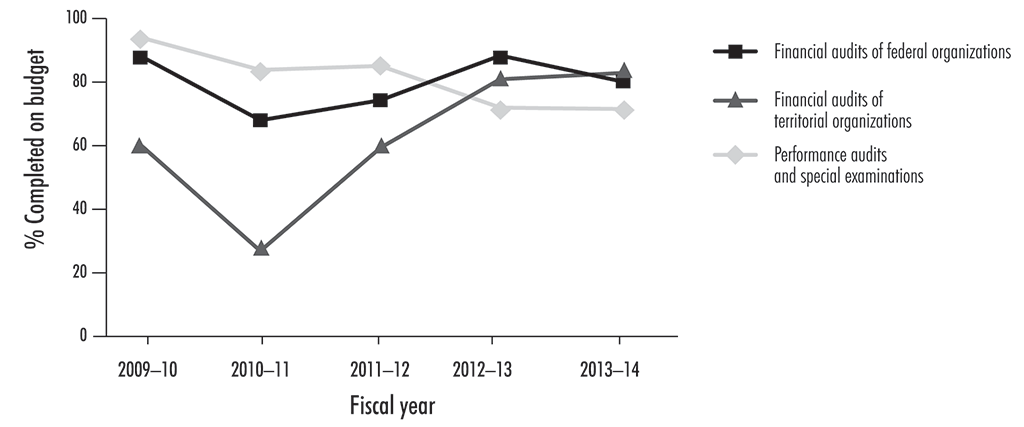
| 2009–10 | 2010–11 | 2011–12 | 2012–13 | 2013–14 | |
|---|---|---|---|---|---|
| Financial audits of federal organizations | 88.40 | 67.80 | 74.20 | 88.50 | 80.30 |
| Performance audits and special examinations | 94.30 | 83.90 | 85.18 | 71.82 | 71.40 |
| Financial audits of territorial organizations | 60.00 | 26.00 | 59.00 | 81.00 | 83.00 |
(Return)